
Technical Diagrams
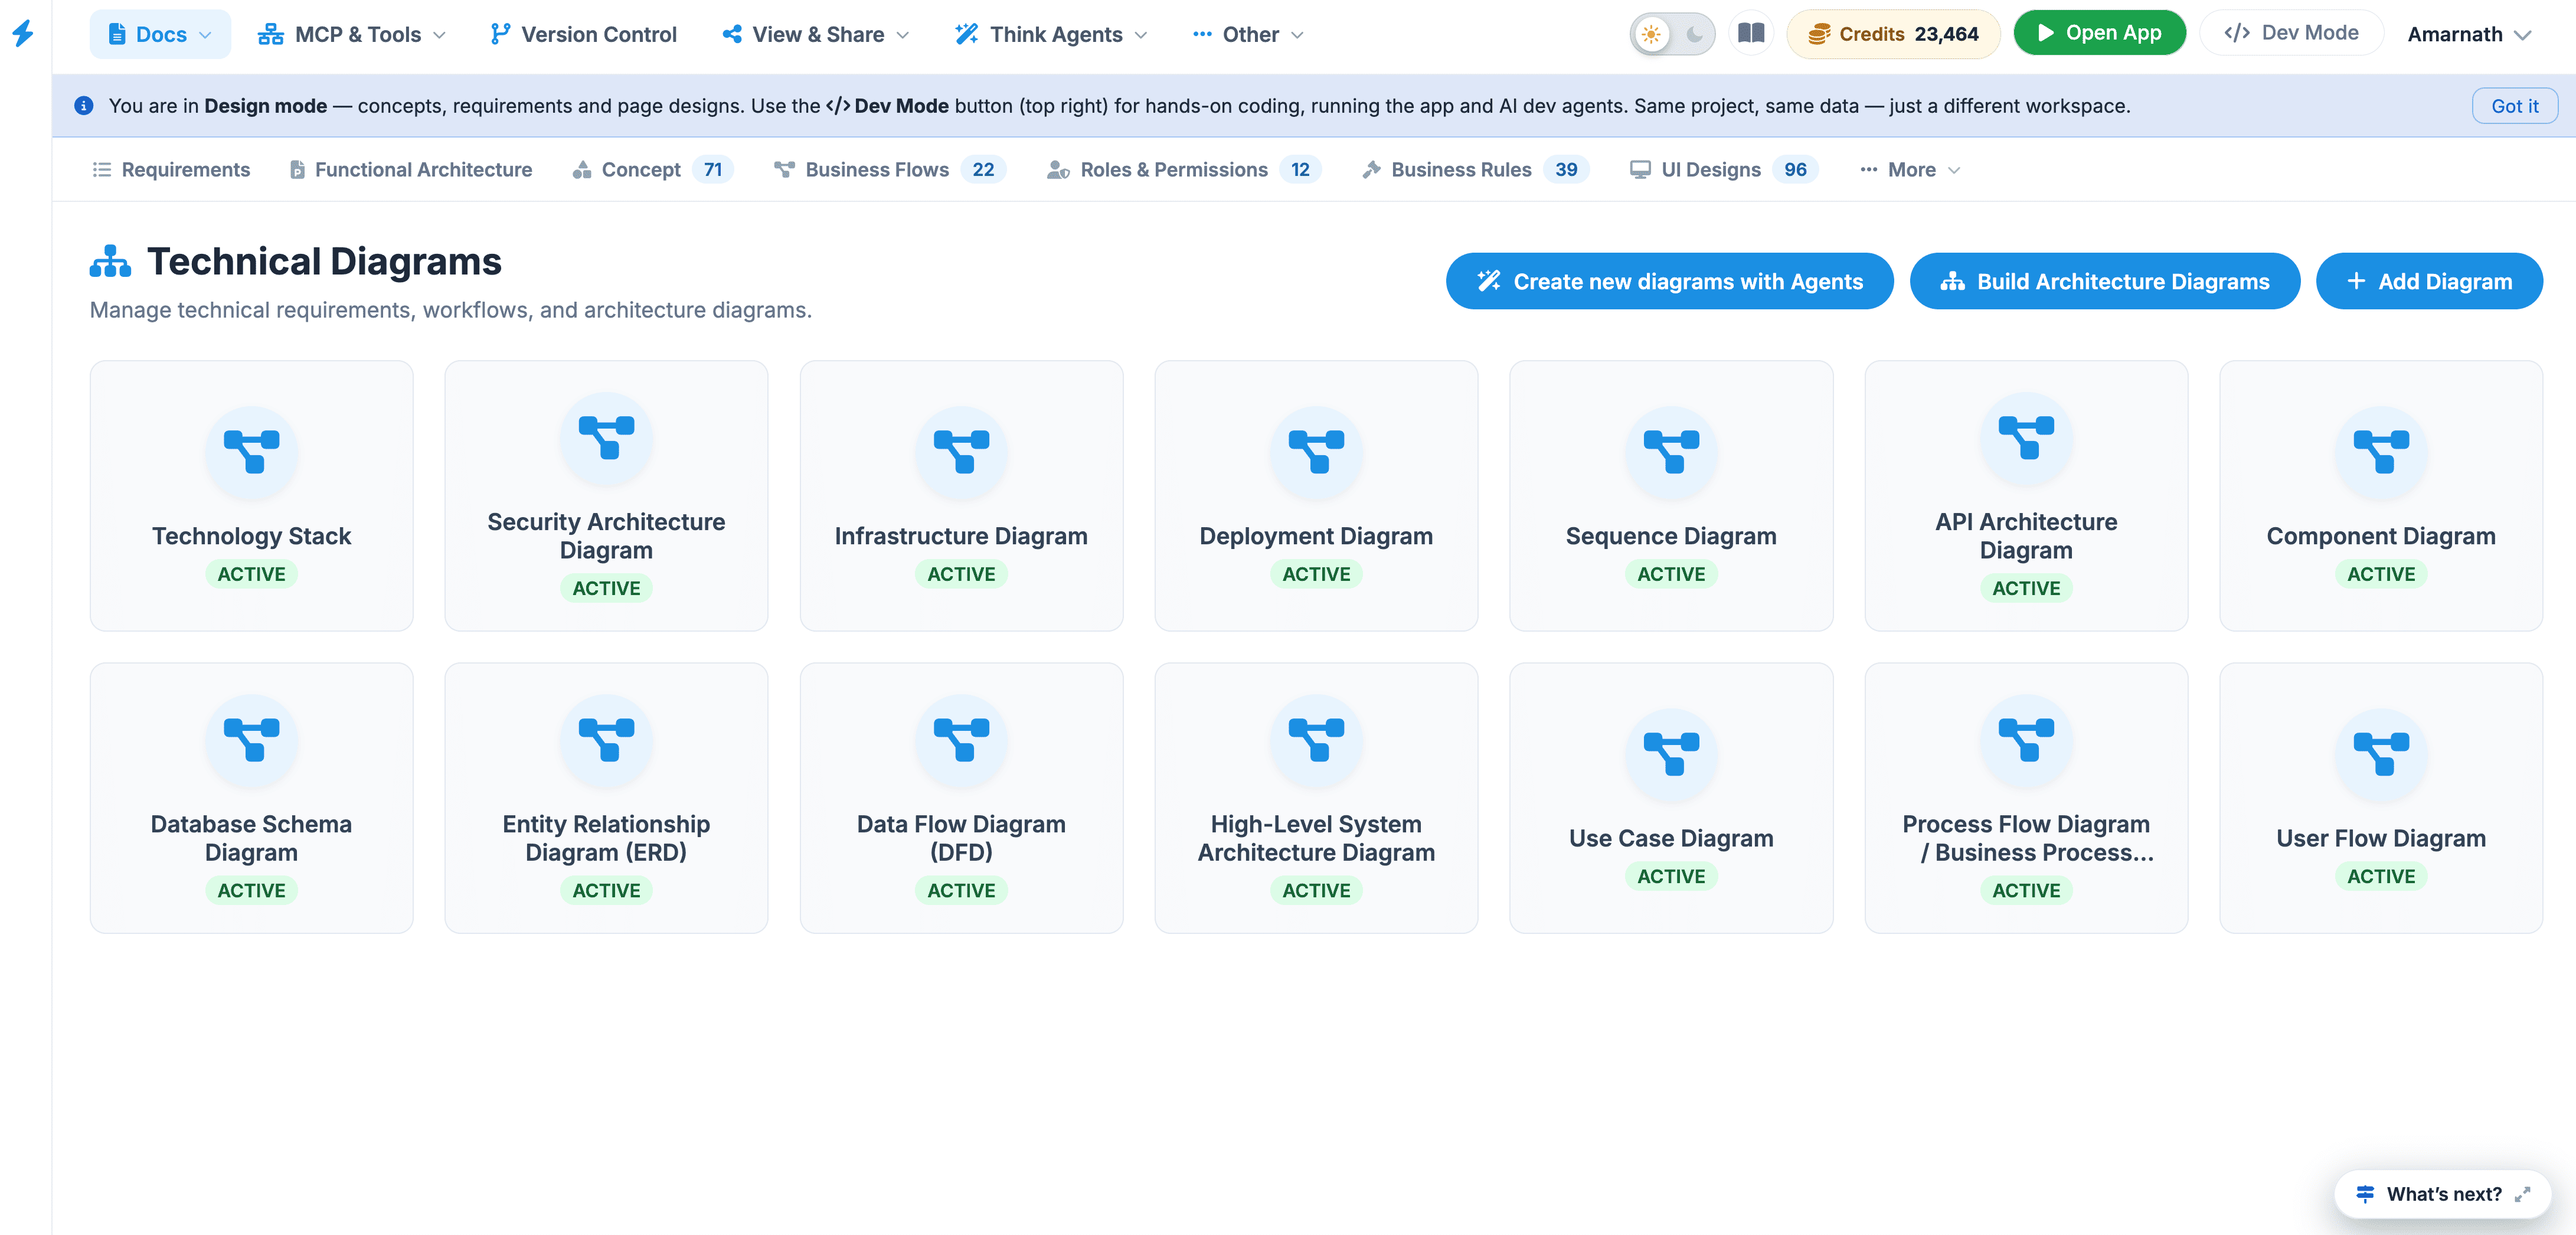
The Technical Diagrams dashboard is a comprehensive visual management suite designed for architects, developers, and system planners. It serves as the central repository for all logic-based and structural visualizations of a project, ensuring that technical requirements and workflows are clearly documented.
The interface displays a grid of Diagram Cards , each representing a specific technical perspective of the system. Each card includes:
- Diagram Type Title: (e.g., Technology Stack, Infrastructure Diagram).
- Status Indicator: An "ACTIVE" badge confirms the diagram is current and validated.
- Standardized Iconography: Uses industry-standard visual markers for quick identification.
 Click to enlarge
Available Diagram Types#
The dashboard is divided into several specialized categories to cover the full development lifecycle:
| Category | Specific Diagrams Included |
|---|---|
| System Architecture | Technology Stack, Security Architecture, Infrastructure, Deployment, High-Level System Architecture. |
| Data & Logic | Entity Relationship Diagram (ERD), Database Schema, Data Flow Diagram (DFD). |
| Process & Flow | Sequence Diagram, Process Flow / Business Flow, Use Case Diagram, User Flow Diagram. |
| Structural Design | API Architecture, Component Diagram. |
Key Action Commands#
Located at the top-right of the dashboard, these controls allow for active project management:
- Build Architecture Diagrams: Launches the automated builder tool to generate diagrams based on existing system data or code structures.
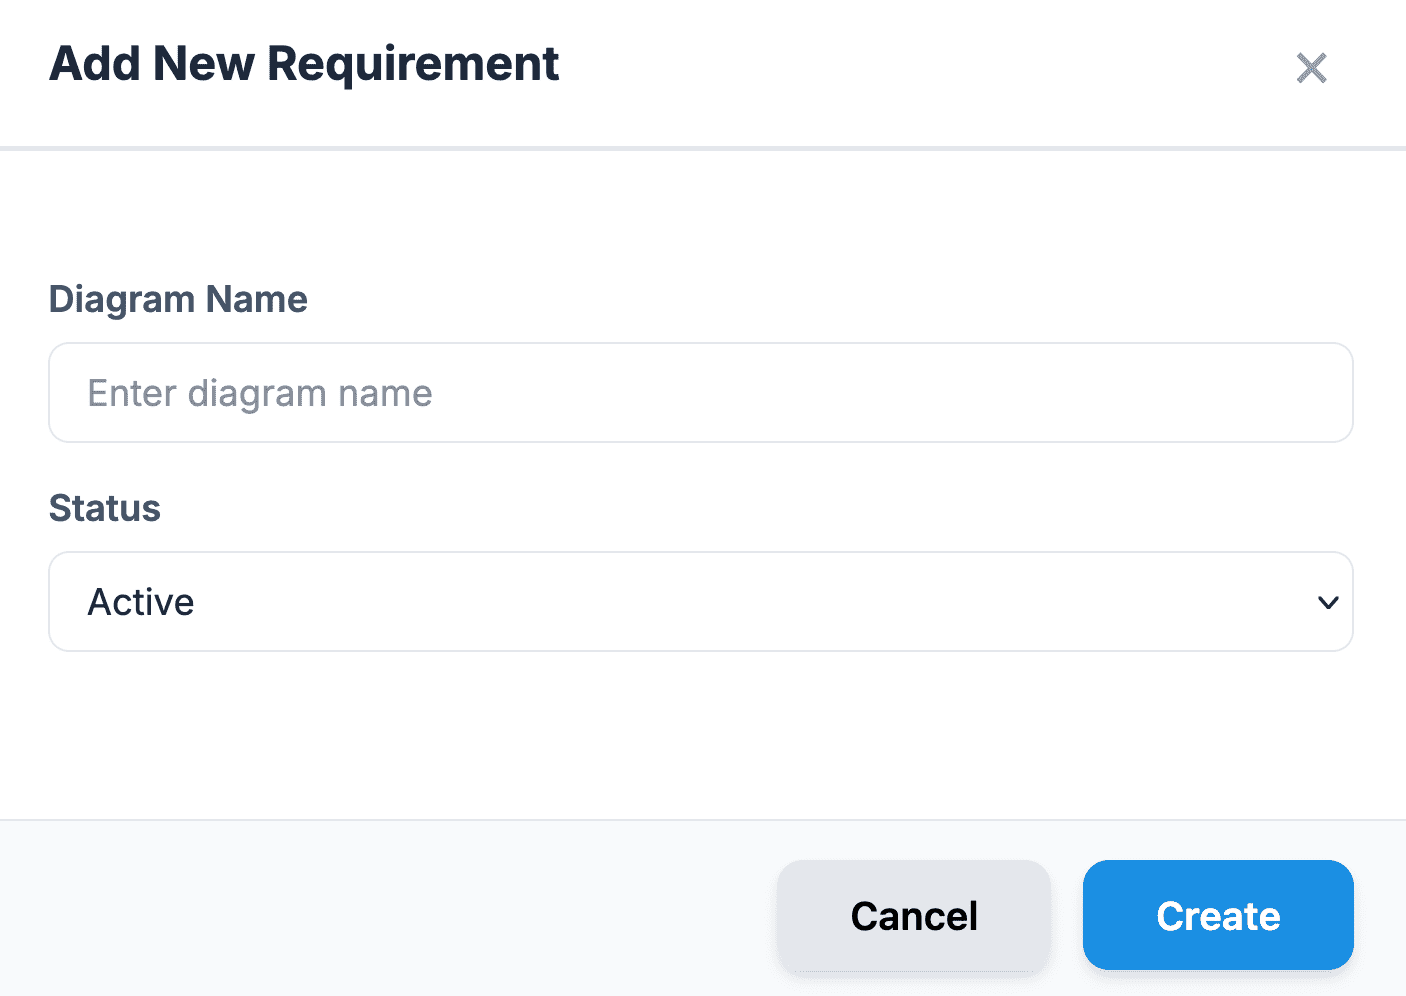
- Add Diagram: Opens a manual upload or creation interface to introduce a new visualization to the project.
 Click to enlarge
Add Diagram#
This button is for manual entry and custom creation .
- How it works: It opens a template gallery or a blank canvas where you can choose a specific diagram type (e.g., Sequence Diagram, ERD, or Flowchart).
- Result: You manually define the logic, shapes, and connections. It can also be used to upload an existing image file (like a png or PDF) from your local drive.
- Best for: Conceptualizing new ideas, documenting specific business rules, or adding external reference diagrams that aren't derived from the project's code.
Click to enlarge
 Click to enlarge
Build Architecture Diagrams#
This button triggers an automated generation process .
- How it works: It uses the platform’s AI or system analysis tools to scan your existing project data, codebases, or infrastructure configurations.
- Result: It automatically creates a "High-Level System Architecture" or "Technology Stack" diagram based on actual project facts.
- Best for: Rapidly documenting complex systems without drawing every line manually, or keeping diagrams in sync with real-time code changes.
Click to enlarge
Click to enlarge
Interactive Diagram Viewer#
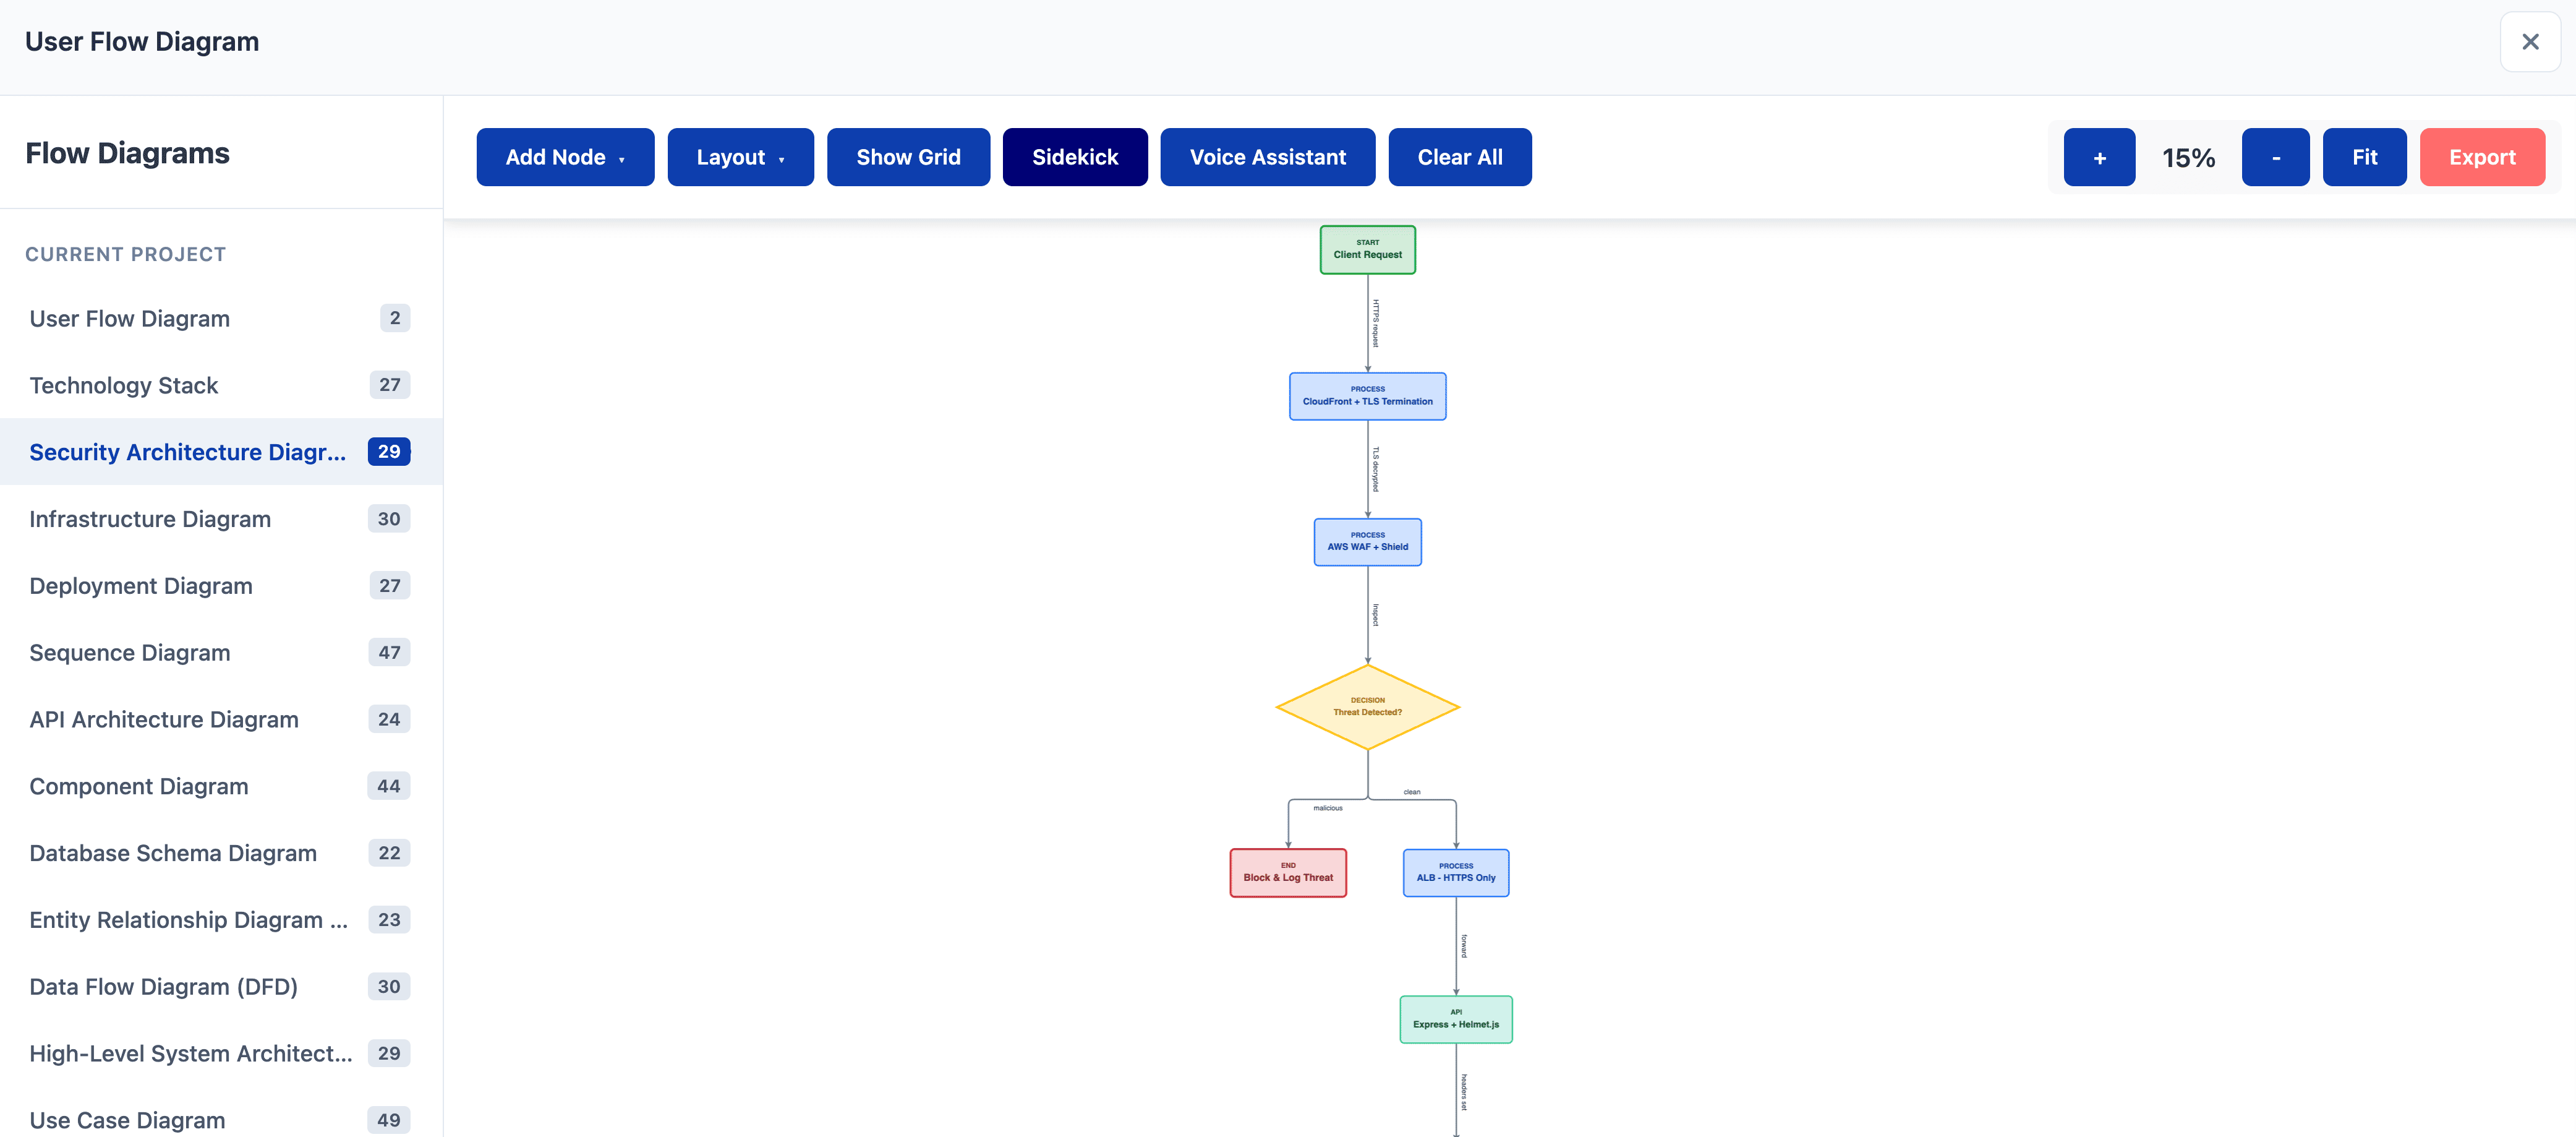
The Interactive Viewer allows you to transition from a high-level overview of your project's architecture to a detailed, editable workspace for any specific technical diagram.
Navigation Workflow#
- Select: From the Technical Diagrams dashboard, click on any of the active diagram cards (e.g., Data Flow Diagram [DFD] ).
- Open: The system launches a dedicated canvas overlay, centered on that specific data model or workflow.
- Explore: Use the sidebar on the left to quickly jump between different diagram types within the same session without returning to the main dashboard.
Workspace Components#
| Area | Description |
|---|---|
| Element Toolbar | Located at the top, this bar provides drag-and-drop components specific to the diagram type, such as Start , Process , Decision , Database , and API nodes. |
| Logic Canvas | The primary area where the workflow is visualized. It supports complex branching, layered layouts, and multi-node connections. |
| Editor Sidebar | Lists all available diagram categories for the current project. Numerical indicators show how many iterations or sub-diagrams exist for each type (e.g., High-Level System Architecture: 42 ). |
| Action Suite | A specialized set of buttons for canvas management, including Auto Layout , Voice Assistant , Clear All , and zoom controls ( 100% , Fit ). |
 Click to enlarge
Key Features#
- Contextual Elements: The toolbar automatically updates based on the diagram type selected, ensuring you use the correct notation (e.g., diamonds for Decisions in a DFD).
- Layout Management: Use the Layered Layout and Direction (Top to Bottom) dropdowns to instantly reorganize complex "spaghetti" diagrams into clean, readable structures.
- Collaboration & Export: Once your diagram is finalized, use the Export button to download the visualization for external documentation or presentations.
Enable the AI Assistant to make rapid changes to your diagrams using natural language commands, similar to the Modify Page tool.